Drug Overdose Deaths: Are we winning or losing less badly?
Contributor: Dr. Jason Hine
Addressing substance use disorder (SUD) remains a pressing issue, not just for healthcare providers but society as a whole. A recent article published in JAMA Network Open, titled “The Decline in Drug Overdose Deaths by Region, Substance, and Demographics,” provides critical insights into the changing landscape of drug overdose deaths. We delve into this study for a clearer understanding, breaking it down into 5 sections with key take aways from each.
Transcript
+
Hi guys. Dr. Hine here from SIM Kit with a quick post on an important topic and an important article for those who provide care for patients with substance use disorder. This could be, again, in the pre-hospital setting. It could be in the emergency department, but this is an important article for those of us who care for patients who use drugs.
So the article is the decline in Drug Overdose deaths by Region. Substance and demographics is published in JAMA Network Open, and it was published in June, 2025 with lead author Laura Ann Post, who’s a PhD. So what they’re looking to do here is get a little bit cleaner and clear, clearer data about the number of drug overdose deaths by one, creating a common denominator.
So the denominator here is deaths per 100,000. Population or people, and then breaking it down into different months and then into different demographics and things, as you’ll see to help us understand what’s happening with substance use disorder and who’s dying of drug or overdose deaths in the United States.
So they looked at the National Center for Health Statistics, drug Overdose deaths tracking Systems. They also looked at the Center for Disease Control and Prevention, wonder Databases and the National Vital Statistics Systems to get their data to compile it. They looked at data from January, 2015, all the way through October, 2024, so about a year ago.
Now, what do they see in their data? So the drug overdose deaths, sadly, was at it’s all time low. In the very first month, January, 2015 was the lowest death rate we had, which is interesting as we talk about decline in US drug overdose deaths, which is the title. So in January, 2015, the rate was 14.5 per 100,000 people.
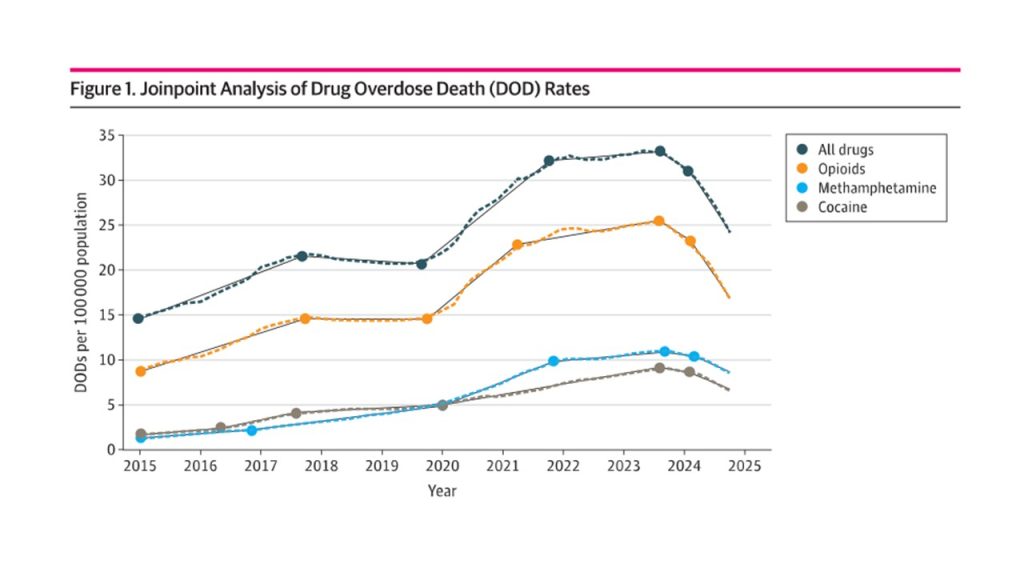
The high was in October, 2023 at 33 and a quarter patients per a hundred thousand. So 14.5 at the low high 23 and a quarter. Pretty staggering differences in those rates. And then we start to, let’s break down some of the data by time and by substance. So here’s figure one, and in this figure we see the rates from 2015 all the way through October, 2024.
With all drugs here in the dark, uh, blue opioids in the orange, amphetamines in light blue, and cocaine in a gray. And as you can see, really most of the all drugs deaths driven by the opioids, by far the most common cause for a substance use related death. They just mirror each other perfectly. And in this dataset we see a pretty steady upward trend from 2015 through kind of mid 2017.
We plateau for a while, and then something happens right around 2020 and we all know what happens. The COVID pandemic hits us and we have a large surge for several years all the way through, as we said, until October, 2023. And from there we see a nice steady decline, particularly in opioid related deaths and a slower decline in amphetamine and con cocaine related deaths.
So that is. Good information. We have not crossed over. As I mentioned in the beginning, our initial rate of that 14 and a quarter, or sorry, 14 and a half we saw in January, 2015, but we are now seeing a decline, hopefully from a peak that we saw in 2023. And the authors in this dataset note that they’ve had a steady decline noted and most rapidly noted in the last nine months of the data that they were analyzing.
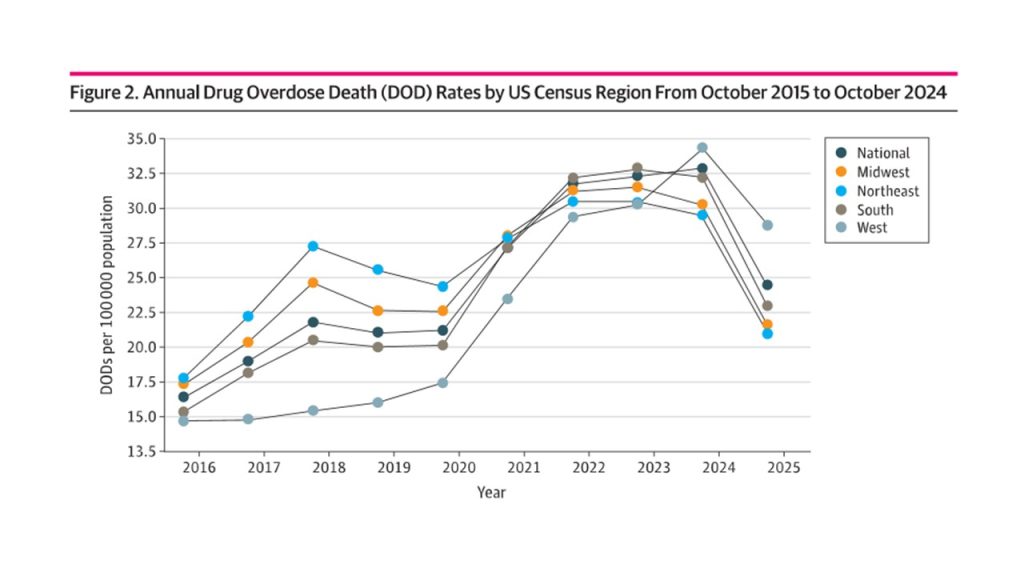
So let’s dive a little bit further into where the deaths are, how they’re coming to us, and break it down by region. Now, as you can see, we have kind of, uh, northeast, Midwest, south and west here, and then the dark blue of national average and being a New Englander. I see and understand this northeast area where from 2016 to 2018, we saw a rapid rise and sort of seemed to be on the.
Forefront of the opioid crisis, opioid pandemic, and the substance use pandemic collectively, the Midwest was our kindred spirit in that and seeing the most rapid rise, uh, but is also seen a bit in the south. Interestingly, the west seemed somewhat immune to this rate of rise. Right up until the pandemic hit.
And then look at what happened in the West. There was a monstrous increase in the number of drug overdose deaths to the point where in late 2023, the West actually overtook all other regions in the number of deaths well above the national average. And so. All of us, all four regions do see a precipitous drop from October or so, 2023 to the end of the dataset, October, 2024.
The rate of decline does appear to be slower in the west, but it is good to see that all four regions have seen that same downward trend. So that’s information about where the death rates are in different areas of the country. What about by different people or populations? Within the United States, here are the deaths by race.
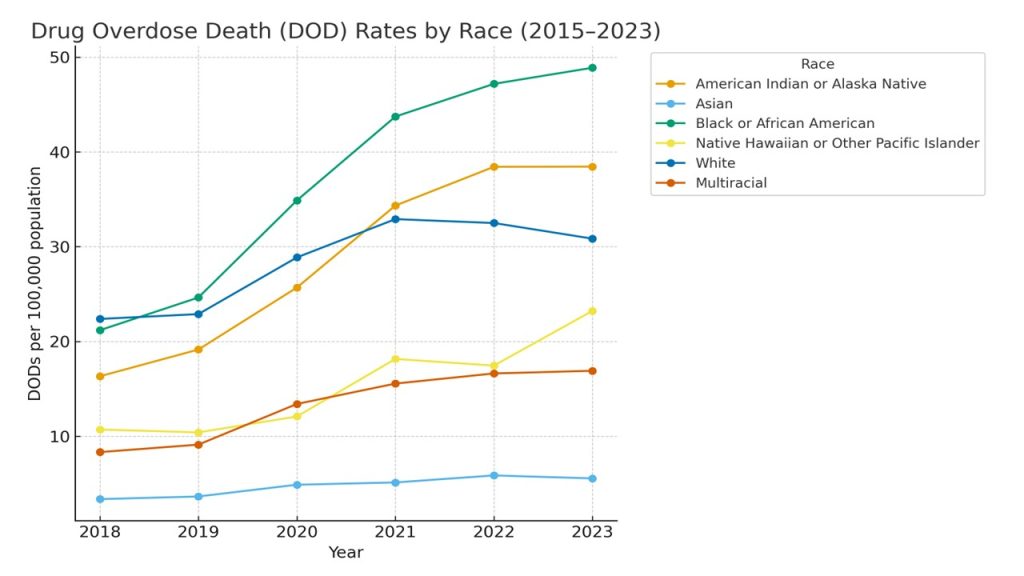
And you can see, you know, probably the midpoint or the point to look at initially, is this blue, Caucasian or white? We see kind of a steadiness in 2018. 2019. Oh, by the way, they did not have. Racial or, uh, ethnicity based data in the years prior to 2018. So we have 2018 on to look at here. And so we see a plateau, 20 18, 20 19, a bit of a rise during the pandemic for the white population and then that downward trend we noted.
Now looking at that and comparing it to the other races on this chart, other races or ethnicities. Particularly, I wanna draw attention to the green line, the Black or African American. This group has seen a upward trend, continually with a gra, thankfully, I suppose you’d say, a slowing in the rate of rise, but still a continued rise.
All the way through 2023 here that can be seen and sort of mirrored in our American Indian or Alaskan native population. We see a bit of an up and down, but again, a continued upward trend collectively. For, uh, native Hawaiian Pacific Islander for multiracial and, uh, the Asian population on the lowest level here, but a slight trend upward there as well.
So unfortunately, when looking at race or ethnicity, we see the white population having that upward rise, but it’s the only group that have a really significant. Downward trend after, you know, 2021 or so every other race or ethnicity has had a continued rise. And particularly concerning is the rate within the black or African American population very important and worth noting.
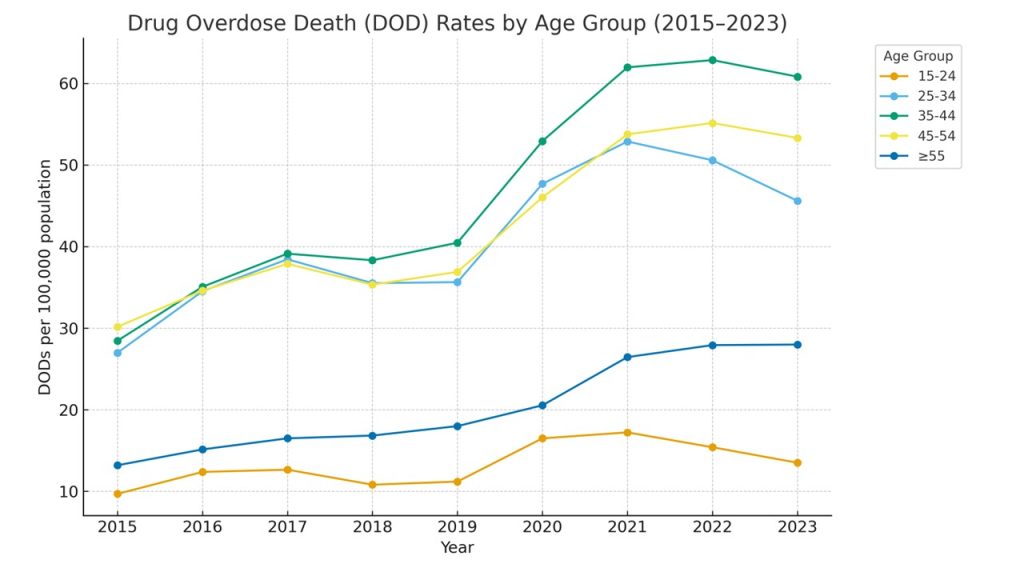
So then let’s break this down in a different way. Looking at different ages and age groups. Here we see things broken down by chunks of 10 years, and we can start kind of, you know, with the, uh, highest percentage, uh, highest rates in that 35 to 44 group. We see that kind of mirroring the data we saw before, uh, upward trend from 15 to 17, kind of plateauing until the pandemic.
Hitting a pretty high peak and then a slight downward trend over time. And we see that sort of same general shape mirrored in all other age groups, except for the 55 plus. We have seen a continued upward trend and either a plateauing or possibly even ongoing rise in that group and in that age group. So most demographics by age have hit that.
Plateau or hit that peak and are now on a downward trend, we have yet to see that in our older population or in our 55 plus. So what does this mean globally for us as providers, we recognize that the opioid epidemic has driven the collective number of drug overdose deaths. We have seen that number go up and e reach its maximum around October in 2023, and that we have seen a pretty precipitous decline.
That precipitous decline I am obviously thankful for and I attribute a lot to our own. Recognition of the treatment options, our own recognition of a desire to avoid stigmatizing or blaming or shaming patients, getting them the Suboxone therapy they need, or methadone therapy. Having peer review and peer support, all the things that we’ve built out to help patients with opioid use disorder in particular seemed to be paying off at this point.
That is collective In the United States, it is not universal and people of different, um, ethnic or racial backgrounds and different age groups are vulnerable populations collectively. Patients with substance use disorder. Are vulnerable, but we need to be aware of these disparities we see in race and in age for the patients we care for.
It can help inform our knowledge of the risk for an overdose death in a patient that we take care of. Maybe going the extra mile, adding extra care, and being conscious of the higher risk and rate of mortality for the patients that we’re caring for, that we see in front of us. So interesting data.
Valuable for us to just know, be aware of. I hope it helps inform you and the care that you provide on a day-to-day basis, I know it is for me. So thank you for listening and until next time,
I.
Keeping your skills up in rare procedures is a constant battle. Time is not on your side and skills naturally decay. Let SimKit do all the heavy lifting with simulation training that delivers to your door once a month. Use coupon code SimKit10 for 10% off
The Article
Decline in US Drug Overdose Deaths by Region, Substance, and Demographics
Overview of the Study
The article aims to cleanly present data on drug overdose deaths, using a standard denominator of deaths per 100,000 people. This approach helps in breaking down the data into months and demographics. They used numbers from three national registries to create their data set.
Key takeaway: Standardizing data provides consistency in analyzing overdose rates across different regions and demographics.
Key takeaway: A detailed temporal analysis (by month) offers insights into when these deaths were most prevalent, and gives greater clarity on trends.
Trends in Drug Overdose Rates
Analyzed data shows that drug overdose deaths were at an all-time low in January 2015 at 14.5 per 100,000 but reached a peak high in October 2023 (Figure 1). Sadly, this was the first month of data we had…. so things just went up from there 🙁
Thankfully, we have seen a gradual downward trend since Oct 2023, but still well above our 2015 numbers.
Key takeaway: A significant rise in drug overdose deaths was observed just prior to and during the COVID-19 pandemic.
Key takeaway: Post-peak, efforts and interventions seem to have positively contributed to the decline in death rates.
Substance-Specific Data
The study highlights that opioids are the leading cause of substance-related deaths, with a notable downward trend observed recently.
Key takeaway: The similarity in the trends of overall drug-related deaths and opioid-related deaths underscores opioids as a major contributor to the problem.
Key takeaway: Opioid-related deaths have shown a sharper decline compared to amphetamines and cocaine, signaling effective targeted interventions.
Regional Differences
Analyzing the data regionally, the Northeast and Midwest initially saw the highest rise, while the West overtook in 2023 with the most significant number of overdose deaths, which continued a profound upward trend until the recent months (Figure 2)
Key takeaway: Regional data suggests that public health strategies need geographic specificity to be effective.
Key takeaway: Despite variance, all regions are experiencing a decline, showing the impact of a collective effort.
Demographic Disparities
Dissecting the data by race reveals that the white population demonstrated a significant decline in deaths, whereas other racial groups generally continuing to see a rise. The most striking rate and rate of rise is seen in the Black or African American populations.
Key takeaway: Interventions have not equally reached all racial groups, highlighting disparities in healthcare access and support (Figure 3).
Key takeaway: Age-specific data indicate those 55+ have not seen a decline, necessitating age-targeted interventions (Figure 4).
Conclusion
The study provides essential insights into the trends of drug overdose deaths, urging healthcare providers to focus on both the continued broad and targeted efforts to curb overdose rates. Understanding these specific trends and demographic variances can inspire and guide more effective interventions and healthcare policies.
Thank you for exploring these insights with us. Let this knowledge guide your practice and commitment to care in the challenging landscape of substance use disorders. Until next time.
References
Subscribe to the Podcast on


Podcast subscription form
"*" indicates required fields